Recommended Posts
- Get link
- X
- Other Apps
Bokeh is a Python library that creates interactive web visualizations. It focuses on delivering elegant, concise construction of versatile visualizations in modern web browsers. Unlike static plotting libraries, Bokeh allows users to explore data directly within the visualization.
Key Features & Why Developers Choose Bokeh:
- Interactive Web Applications: Bokeh is designed specifically for creating interactive visualizations that run in web browsers.
- Large Datasets: Handles large and streaming datasets efficiently, making it suitable for real-time data visualization.
- Customizable: Offers a high degree of customization, allowing you to tailor the appearance and behavior of your visualizations.
- JavaScript Integration: Bokeh generates JavaScript code under the hood, providing a smooth and responsive user experience.
- Standalone HTML: Bokeh visualizations can be exported as standalone HTML files, making them easy to share and deploy.
- Integration with Other Libraries: Works well with NumPy, Pandas, and other Python data science libraries.
- Streaming Data Support: Excellent for visualizing data that is updated in real-time.
Simple Example: (Creating a simple scatter plot)
from bokeh.plotting import figure, show
from bokeh.models import ColumnDataSource
import numpy as np

# Sample data
x = np.linspace(0, 10, 100)
y = np.sin(x)

# Create a ColumnDataSource
source = ColumnDataSource(data=dict(x=x, y=y))

# Create a figure
p = figure(title="Interactive Sine Wave", x_axis_label="X", y_axis_label="Y")

# Add a scatter plot
p.scatter('x', 'y', source=source, size=10)

# Show the plot
show(p)
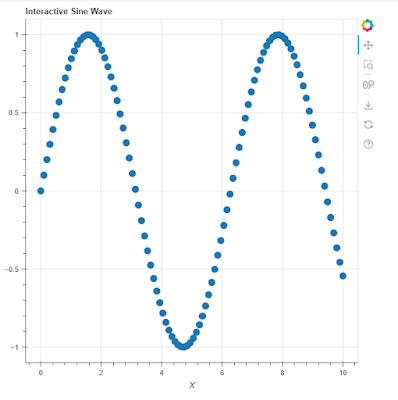
This example creates a scatter plot of a sine wave using Bokeh. The plot will be interactive, allowing you to zoom, pan, and hover over the data points.
In short:
Bokeh is a powerful library for creating interactive web visualizations in Python. Its ability to handle large datasets, its customization options, and its focus on web-based interactivity make it a great choice for data exploration, analysis, and presentation.
Keywords: Bokeh, Python, Interactive Visualization, Web Visualization, Data Visualization, Scatter Plot, Line Chart, Large Datasets, Streaming Data, Data Science, Data Analysis.

Comments
Post a Comment